
Last time, we shared the Triangle MLS Video Update so now let’s look a little closer at the local real estate market as of April 2019.
While the video oftentimes refers to month-over-month changes, we prefer to only look at at least quarterly activity or to compare year-over-year (April 2019 to April 2018). Our next quarterly update will come out in late July.
For our updates, we talk about the Triangle market as a whole, and then the 2 largest sub-markets:
- Single family resale homes in Wake County
- Single family resale homes in Raleigh
Given the averages in these markets, we further break them down by price range – above or below $400,000 for the entire market; above and below $500,000 for Wake County & Raleigh.
We report and then comment on these major data points:
Average Sales price
The number of Homes Sold
The average DOM
The median DOM (see explanation if it’s confusing)
This month, we’re also reporting on the number of New Listings compared to April 2018, since “Inventory” remains our bugaboo, and so getting more of it is critically important.
Here’s the chart for the entire Triangle MLS:
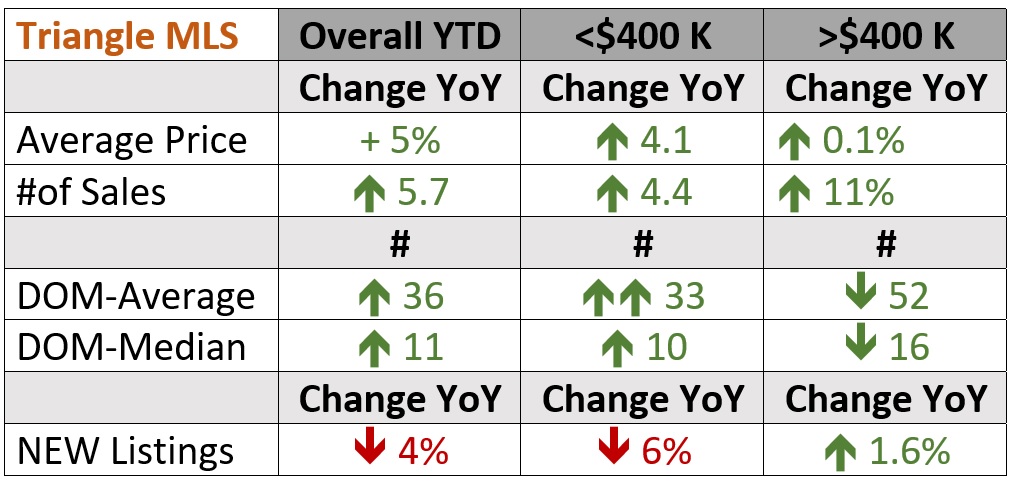
As noted last time, the overall market remains steady and positive:
- prices are up a strong but not unsustainable 4-5%
- the number of homes sold continues to rise
- the Days on market is steady – though they’re UP for < $400K homes and DOWN for > $400K homes
- *the BAD news? New listings still lag – and they’re actually DOWN when we need them way UP! That jibes with Stacy Anfindsen’s comments in the video.
The Days on Market – as the overall price of homes increases, then more will sell in the higher price range than before. That’s why the # of sales is up 11%, and as price and quantity of Buyers creep up, the days on market went DOWN 12% on average.
And we see this effect across the board – the higher price ranges (though on the lower end of them) are seeing increased activity. You’ll notice this in the Wake and Raleigh sub-market charts!
Here’s the info for Wake County resale homes, comparing year-over-year:
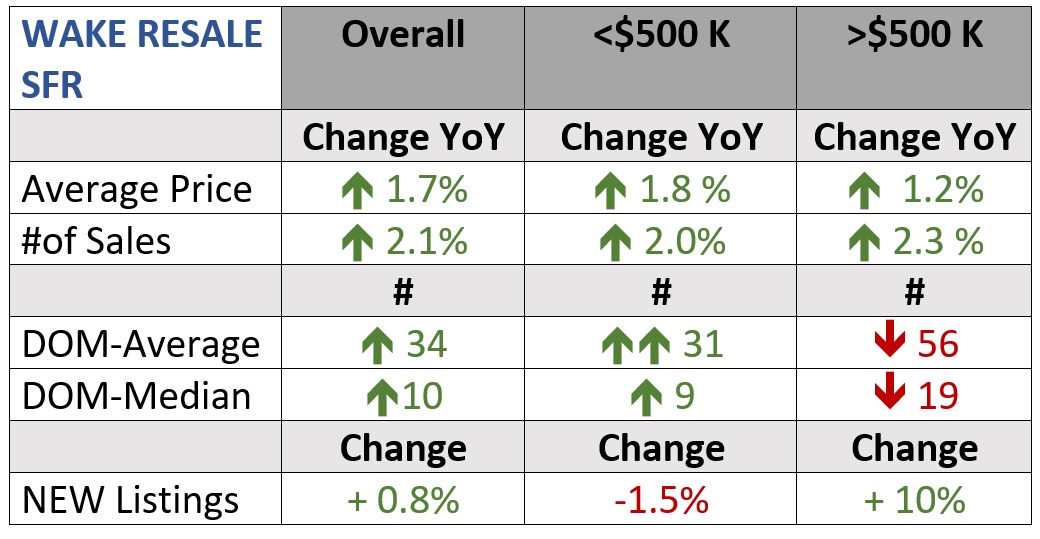
- Again, prices and the number of sales are “modestly” up, though up LESS than the overall market (1.7% price increase vs 5%)
- We saw increases in both Median and Average Days on Market, though they were so low in April ‘18, we would expect an increase.
- DOM for homes > $500K did DECREASE however
- The >$500K market is the only one that had MORE new listings – a nice 10% increase!
The Raleigh market was VERY similar to Wake County:
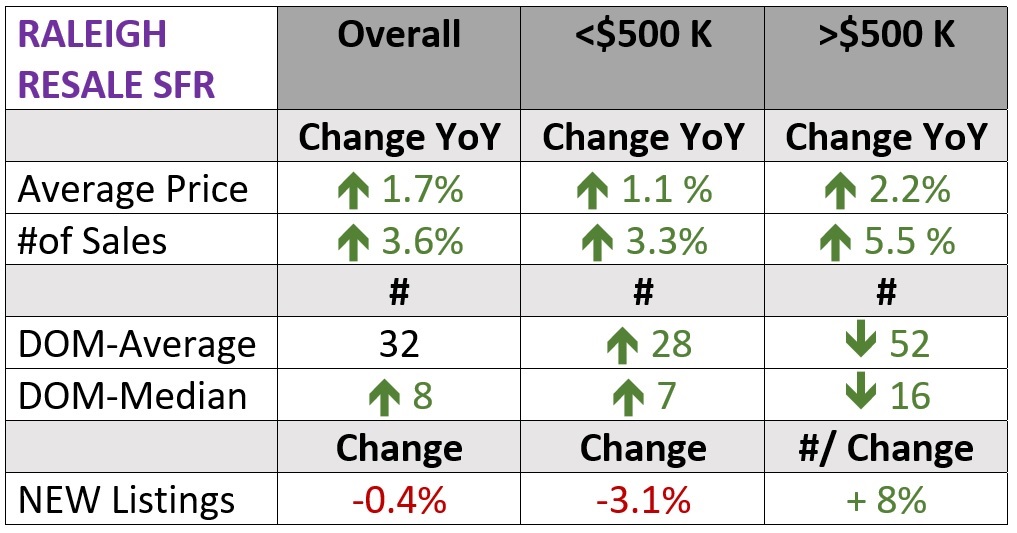
- Prices and number of homes sold modestly higher, and again less than the entire Triangle market (1.7% vs 5%)
- The median DOM rose, but the average stayed the same
- DOM, the # of sales, and the # of new listings > $500K showed solid gains
What do these gains in the Higher Price Market Mean?
For many people, the gains that are “finally” occurring in the >$500K market are welcome news:
- As prices rise and higher-paying jobs continue coming to town, we’ll naturally have more homes sell in that price range
- Sellers in that submarket are finally believing in the strength of the market and putting their homes up for sale
- While it’s nearly impossible to sell <$500K any faster than they already are, there were measurable gains over 2018 in the speed that homes sell in
- From a strictly economic sense, we’d point out the supply/demand balance – prices did rise “only” 2.2% over 2018 because finally, more listings are available to meet the demand, but …
- We need even MORE new listings over $500K, as evidenced by the large decrease in Average/Median DOM.
Our next update will cover the 2nd quarter of 2019, and we’ll have it ready before the end of July. The 2nd quarter is ALWAYS the busiest, so this will give us the BEST comparison of how the year is going, and what may happen for the rest of 2019.