
Sometime around the middle of each month, you’ll see news stories about the ups and downs of the real estate market. A good month can sound amazing, and any slip from the mountaintop might sounds like calamity.
Toss in the need for a catchy headline – and the actual merits of the current market might be wildly exaggerated.
Here’s one from Realtor.com:
Happy Spring: Home Sales Post Strong Rebound
“Existing-home sales surged last month, posting their largest month-over-month gain since December 2015, the National Association of REALTORS® reported Friday.”
Here’s a recent article from the News & Observer:
Triangle housing market started the year slowly, but things are looking up
“The Triangle housing market’s start to 2019 has been a “mixed bag” so far. While sales were still down in the first month of the year, conditions in the housing market have improved since the slowdown at the end of last year…”
One agent quoted even said “It feels like we’re a month behind.”
If we’re too focused on monthly activity, we find:
- January Sales were DOWN 6.4% (sounds bad!)
- But by the end of February, sales had rebounded so that year-to-date, we’re already back UP 4.2%. So, we’re not behind at all.

Something like this, obviously not so big:
Every month, sales go up and sales go down. Most people know that more homes sell between April and June than sell from November through January. But not all January’s are equal either, and then we have to consider what may have affected those sales …
Was there a snowstorm (or in warmer months, a hurricane)?
Were the public schools on Spring Break that month (sometimes it’s split between March and April, and sometimes it’s just April like 2019)?
And more importantly – these multi-day events don’t skew the closings the month they happen … unless it’s a big snowstorm at the end of a month where the Courthouse is closed. A mid-January snowstorm that brings Raleigh to its knees means folks aren’t LOOKING at homes and making offers during the storm. But the closing is always 30 to 60 days later. So, a January storm really affects mostly February and somewhat March closings.
Invariably, an unexpected “dip” in one month is met with a rise the next month, such the 2 balance out. For this reason, we don’t often focus on monthly numbers – even when we’re contributing to the TBJ and letting them know February 2019 sales were up 13% over 2018. (should be a link, put my quote in a box here)
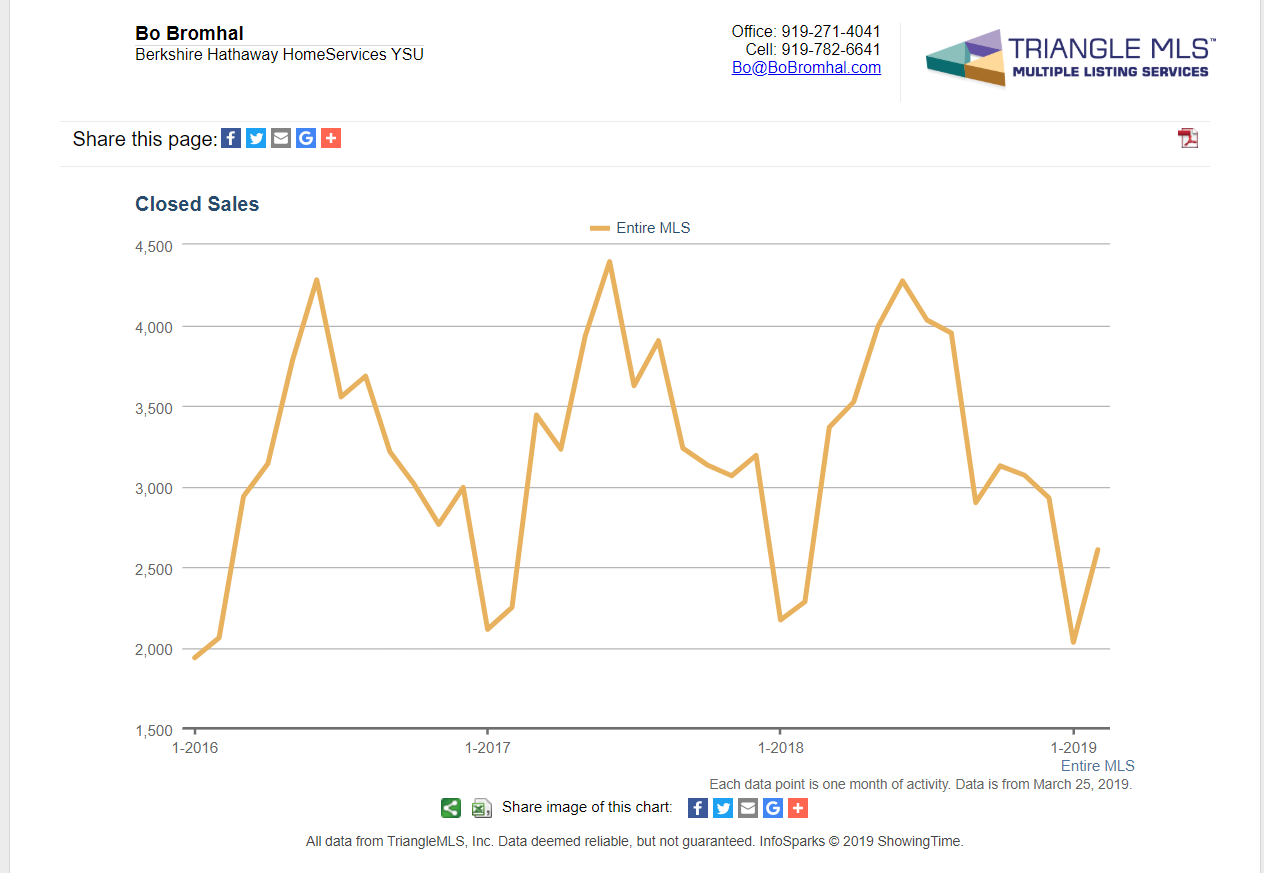
Or, more graphically shown, here’s what monthly sales look like in the Triangle for the last 3 years …. Careful, don’t cut yourself on those jagged edges.
Instead, we look at activity on a quarterly, semi-annually, and annual basis.
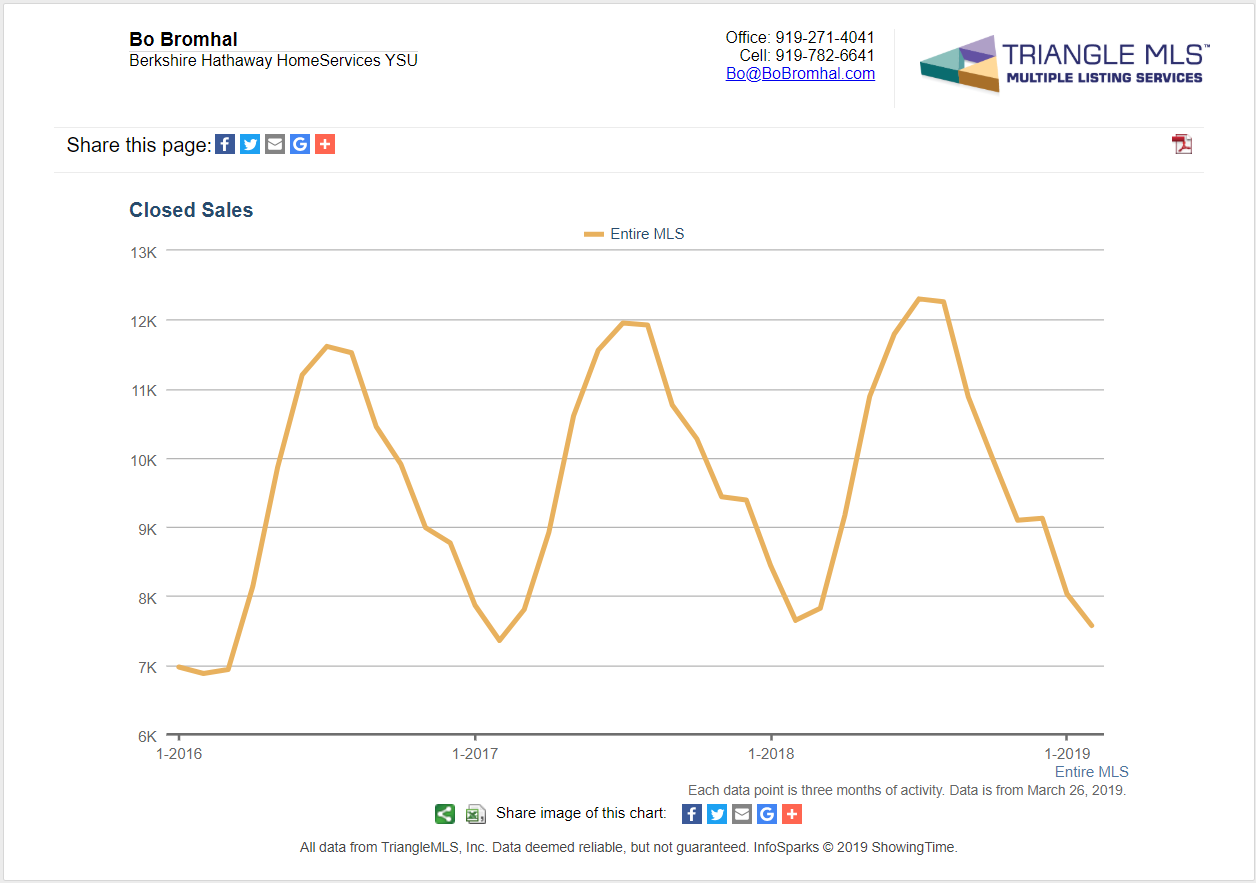
Here’s what a quarterly report looks like. Looking every 90 days is important because appraisers are looking for comparable sales information over the last 90 days.
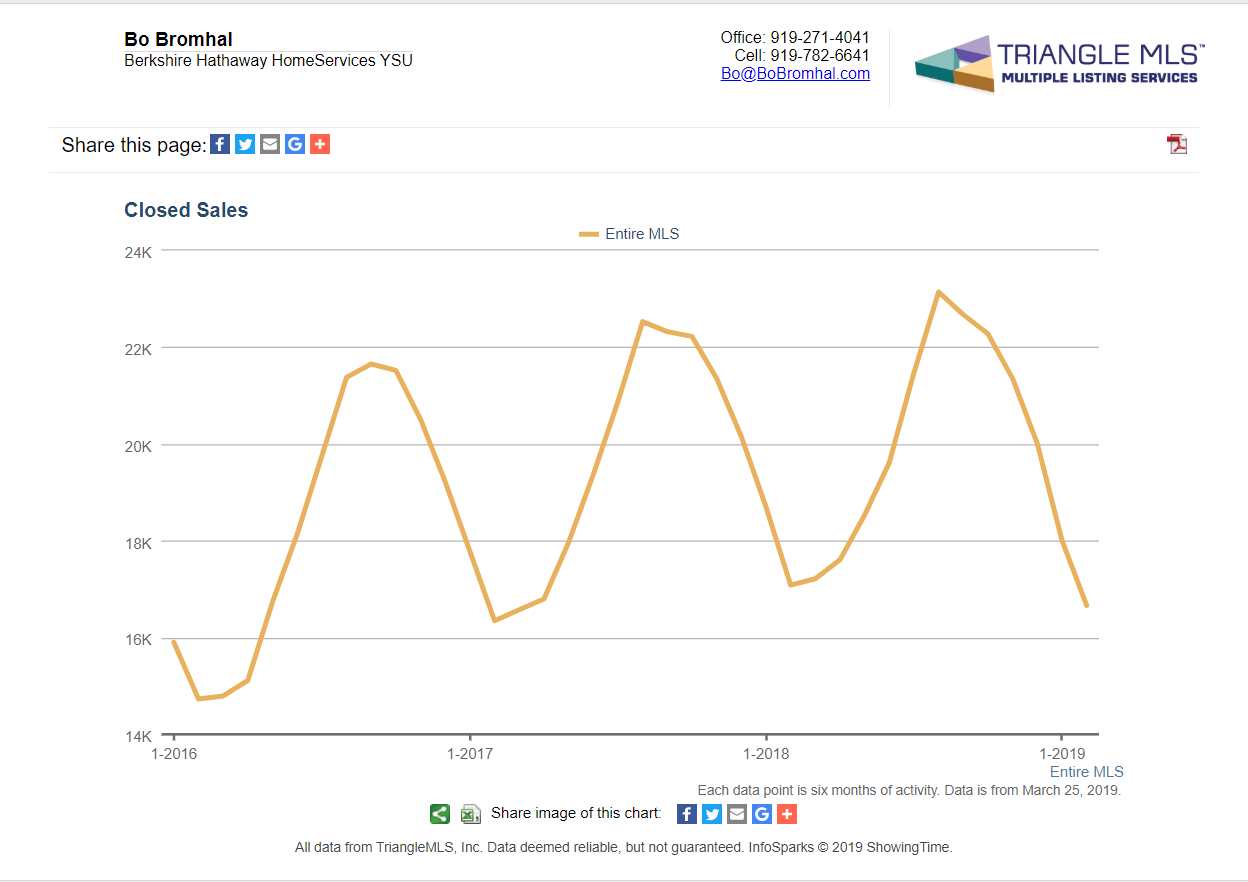
If we use the same information – closed sales – and look at a rolling 6 months, it’s a much smoother curve, and look – the seasonality of a typical market is so much clearer.
So, be on the lookout for our QUARTERLY Market Review that will provide a clearer picture of the Triangle market. It should be ready right before Tax Day!